

Plotting with Pandas
Pandas provides a convenient plot() method to create visual representations of your data. Behind the scenes, it leverages Matplotlib, a powerful visualization library in Python.
To display these plots, we use Pyplot, a submodule of Matplotlib.
Want to explore more? Check out our Matplotlib Tutorial for detailed guidance.
Program
Let's import pyplot from the matplotlib library and visualize a DataFrame from a CSV file:
import pandas as pd
import matplotlib.pyplot as plt
df = pd.read_csv('data.csv')
df.plot()
plt.show()

This will generate plots for all numerical columns in the dataset.
The examples on this page use a sample CSV file named data.csv.
Download data.csv | Open data.csv
Scatter Plot with Pandas
To generate a scatter plot in Pandas, simply set the kind parameter to 'scatter' in the plot() method.
A scatter plot requires two variables: one for the x-axis and one for the y-axis.
In the example below, we’ll plot "Duration" on the x-axis and "Calories" on the y-axis using the x and y arguments.
program
import pandas as pd
import matplotlib.pyplot as plt
df = pd.read_csv('data.csv')
df.plot(kind='scatter', x='Duration', y='Calories')
plt.show()

This example uses a CSV file named data.csv.
Histogram with Pandas
To create a histogram in Pandas, set the kind parameter to 'hist' in the plot() method.
Unlike other plots, a histogram only requires one column. It helps you understand the distribution of data by showing the frequency of values within specific intervals.
For example, a histogram can show how many workouts lasted between 50 and 60 minutes.
Program
df["Duration"].plot(kind='hist')
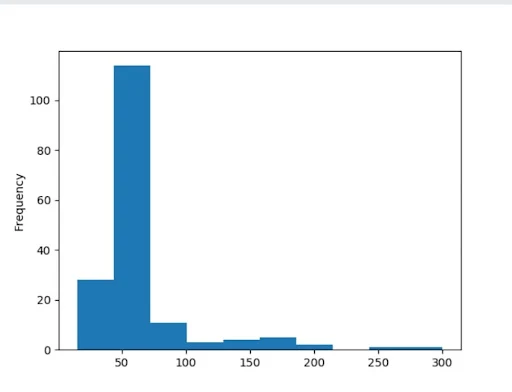
This will generate a histogram based on the Duration column.
In this case, the histogram reveals that more than 100 workouts lasted between 50 and 60 minutes